S&P 500 and Stock futures dropped on October 31, when investors digested not-so-good results of the tech corporations and, on the other hand, looked forward to reports from Apple and Amazon.
S&P 500 futures fell by 0.5%, with the Nasdaq 100 and Dow Jones futures equally falling by 0.6% one day subsequent to the U.S. CPI year changes that rose 8.3% compared to the previous year.
Meta Platforms’ premarket performance contributed to the cautious sentiment. Shares fell 3% as the company missed its user growth goals. Additionally, Meta announced that capital expenses will rise sharply in 2025, which contrasts with its strong third-quarter earnings.
Microsoft’s revenue projections did not attract investors, leading to a 4% fall in its stock price in premarket trading, as Wall Street altered its growth expectations in the light of the company’s muted outlook.
Wall Street Awaits Key Tech Earnings from Apple and Amazon
On the economic side, the latest personal consumption expenditures (PCE) price index was released. This index, a key inflation indicator for the Federal Reserve, showed that inflation increased as expected, nearing the Fed’s 2% target. This data suggests that inflation may be easing. However, investors remain cautious. They are wary of how both sluggish corporate earnings growth and inflation could impact overall market sentiment.
On October 30, the major stock indexes showed slight declines; the S&P 500 slipped by 0.3%, the Dow decreased by 0.2%, and the Nasdaq Composite declined by 0.6%. As far as Wall Street is concerned, investor attention has been shifted to the results of Apple and Amazon, particularly as to the viability of the development of the tech sector amidst a deteriorating economic environment. Most likely, these companies’ announcements will be the turning point of the earnings season.
S&P 500 Index Technical Analysis
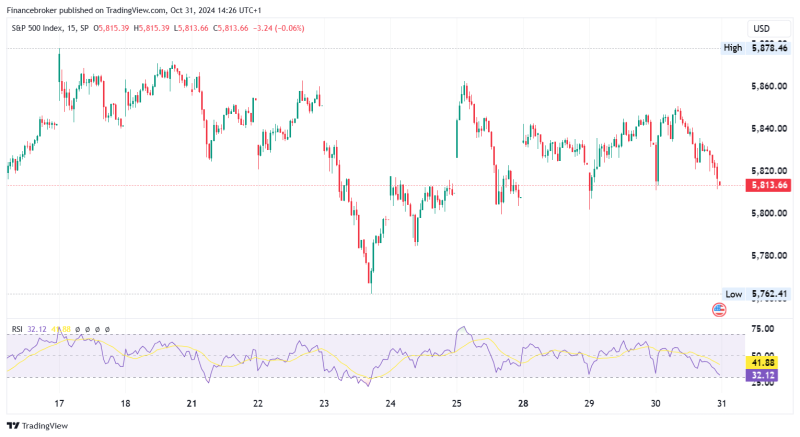
S&P500/USD 15-Minute Chart (Source: TradingView)
Today, the S&P 500 index is experiencing slight pressure. The price stands at 5,813.66, the same percentage down as before. Over the past week, the index reached a high of 5,878.46. Since then, it has been gradually declining, forming lower highs and lower lows. Thus, the probable conclusion is that momentum is slowing down, and a cautious sentiment is setting in.
Key Support at 5,762.41 in Focus as Short-Term Bearish Trend Prevails
The Relative Strength Index (RSI) of the S&P 500 stock currently stands at 32.12, which is pretty much near the oversold territory. However, the RSI is trending downward. The 15-minute chart also shows a series of uninterrupted red candles. This indicates that, for now, the short-term bears are in control and are overpowering the bulls.
Monitoring the nearest support level of 5,762.41 is a must. When a state of steadiness emerges among traders and the RSI begins to trend upwards, it may boost buyers’ confidence. This upward movement could indicate a short-term buying opportunity.
In the short term, we are likely to see a cautious style of trading. This is displayed by range-bound situations in the market as investors monitor external factors, such as upcoming economic data and macroeconomic news. A breakthrough above the recent high of 5,840 could signal a revitalisation of buying interest in this stock.
In case you are already holding positions, look at the resistance line at around 5,840 and be extra cautious about it as breaking above it may indicate a comeback to the bullish trend. Be aware of the most recent economic data releases, as they are a major driver of market psychology.
The post S&P 500 Slide 0.48% as Wall Street Weighs Tech Earnings appeared first on FinanceBrokerage.

