Overall Analysis
Bitcoin’s sharp rally towards the $88,398 level has sent the crypto market sky-high after the US election results.
Ethereum surged by +5.91% on November 11th, currently testing a resistance level.
Bitcoin Chart Analysis
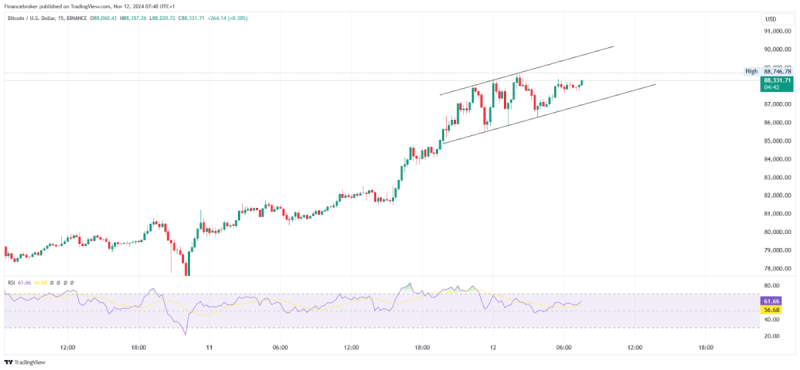
BTC/USD 15-Minute Chart (Source: TradingView)
On the November 11th, 2024, trading session, Bitcoin marked another all-time high of $88,398. The price has continued to set new all-time highs for the last seven trading sessions, delivering 30% returns to traders and investors since the US election results.
Currently, on both the daily and hourly time frames, the BTC price is in an overbought scenario and has been for an extended period. The price is advancing without forming clear swings or pauses, making it challenging to determine precise entry or exit points. Targets can be set using a trailing stop-loss strategy based on the previous candle’s low.
On the 15-minute time frame, the price continues to move upwards in a channel-like structure. Additionally, the RSI shows signs of cooling off after each rally.
Below are a few entry triggers:
The price is currently moving within a channel-like structure. If it takes support from the supporting trendline, buyers may consider entering with a stop-loss placed below the previous swing low and a target set at the resistance trendline.
If the price breaks below the supporting trendline and continues its decline, sellers may consider entering with a stop-loss above the previous swing high and targets set at $84,000 and $81,700, using a trailing stop-loss strategy.
Ethereum Chart Analysis
ETH/USD 15-Minute Chart (Source: TradingView)
On the November 11th, 2024, trading session, Ethereum rose by +5.91%, delivering 41.67% returns to traders and investors since the US election results.
Currently, on the daily time frame, Ethereum has been in an overbought scenario for the last three trading sessions. It is facing rejection near the $3,373 level, which aligns with its previous swing high. The price needs to pause around this area to facilitate a continuation of the rally.
On the 15-minute time frame, Ethereum’s price can be seen breaking out of patterns. A previous “peanut breakout” facilitated a rapid upward move. Currently, the price is forming an ascending pattern near the $3,373 resistance level. A breakout could trigger a strong rally.
If the price breaks above the $3,373 level and sustains it, buyers may consider entering the trade with a stop-loss placed below the previous swing low and targets set on a trailing basis.
The post Bitcoin Hits $88,000 All-Time High, Ethereum Surges 5.91% appeared first on FinanceBrokerage.

